
- These list items are microformat entries and are hidden from view.
- https://dltj.org/article/python-structlog-for-aws-lambda-cloudwatch/
 Peter Murray
- I was introduced to structured logs at work, and this ol’ hacker thinks that is a darn good idea. For a new program I’m writing, I wanted to put that into use. The program uses AWS Lambdas, and the log entries for the Lambdas end up in CloudWatch Logs. Unfortunately, in its default configuration, the output is less than useful: Default configuration structured logs AWS has configured the default Python logger in the Lambdas to automatically put the timestamp and the HTTP API request ID from the context in the display when the log line is collapsed. When you expand the log line, you can see the additional detail in structured JSON. That timestamp is duplicated in the column to the left, and the UUID is really not useful in this context. What I’d rather see is the event that caused the line to be logged and any corresponding error message. Enhanced configuration structured logs It took some trial and error to make this happen. This post describes that process in case I or anyone else needs this in the future.The Usefulness of Structured LogsI believe the widespread use of format strings in logging is based on two presumptions:The first level consumer of a log message is a human.The programmer knows what information is needed to debug an issue.I believe these presumptions are no longer correct in server side software.—Paul QuernaThis quote is from a 2011 blog post. It’s only now that I’m getting involved with troubleshooting distributed systems running on AWS that I appreciate the value of Paul’s insight.The ability to search the contents of log files combined with the ability to correlate log messages from disparate programs is a real game-changer. (This coming from a programmer who still feels most comfortable trolling through /var/log with liberal grep and awk commands.)I’ve seen the light. And so with this new effort, I’m using the Python Structlog package to simplify the building of the stuctured logs. The problem is that AWS is too smart for its own good. When you use the AWS-supplied Python installation, it: Sets the log level to WARN, and Sets the format string to include the timestamp and UUID of the Lambda call in front of anything you want to log.Both of those are really annoying. The way to get around the first is somewhat cumbersome, as this answer on Stack Overflow describes. The nicest solution—if you are using Python 3.8 or higher—is to use the force=true on the logging.basicConfig call:123456 logging.basicConfig( format="%(message)s", stream=sys.stdout, level=logging.DEBUG, force=True, )The second line of this code snippet is the start of the solution to address the second problem described above—it clears out the AWS-supplied formatting string. In its place, we will put our own formatted string.Tricking CloudWatch to Display Useful ContentI couldn’t find this documented anywhere, but there is a special format to CloudWatch lines that make them machine-processable. If a program logs a line with three space-delimited fields followed by a string of JSON, CloudWatch will parse that JSON in the display and make it searchable. In the default configuration, the three space-delimited fields are the log level (e.g. “[INFO]”), timestamp, and request UUID. With our own Structlogs procesor, we can put what we want in those space-delimited fields. I copied the built-in structlog.processors.JSONRenderer class and made the modifications to put the log level and two arbitrary values at the beginning of the log line. You can see this effort in the AWSCloudWatchLogs class in log_config.py on GitHub.Calling the setup looks like this:1234def handler(event, context): setup_logging(context) log = structlog.get_logger() log.info("STARTED", httpapi_event=event)And an error log entry (with a reason variable) looks like this:12 reason = "Invalid Zoom POST content received" log.error("POST rejected", reason=reason)You can see the results in the second screenshot above.The best part is that because CloudWatch interprets the contents of the JSON part of the line, I can still collate together all of the log lines that correspond to a particular API Gateway request:{ $.aws_request_id = "0d7924bb-ed97-4aa2-898f-90520a9f2e1b" } Searching structured logs The AWS documentation has instructions for the query syntax to matching terms in log events.
- 2022-01-22T00:00:00+00:00
- 2024-07-20T16:35:17+00:00
A Better Structlog Processor for Python for CloudWatch Logs Using AWS Lambda
I was introduced to structured logs at work, and this ol’ hacker thinks that is a darn good idea. For a new program I’m writing, I wanted to put that into use. The program uses AWS Lambdas, and the log entries for the Lambdas end up in CloudWatch Logs. Unfortunately, in its default configuration, the output is less than useful:
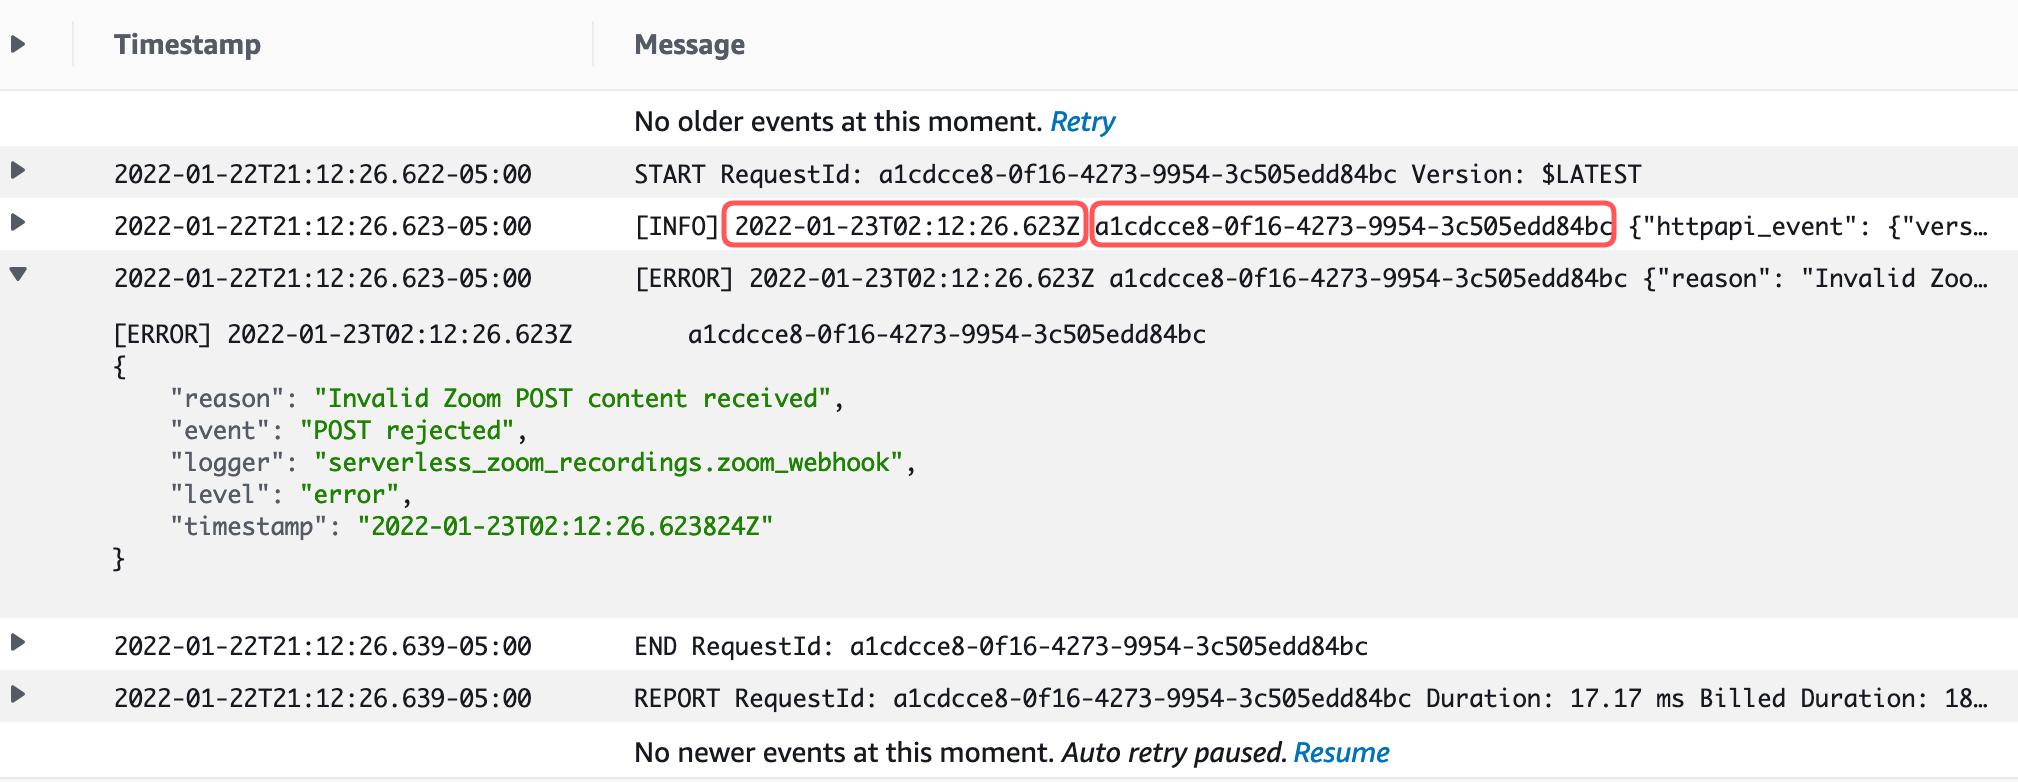
AWS has configured the default Python logger in the Lambdas to automatically put the timestamp and the HTTP API request ID from the context in the display when the log line is collapsed. When you expand the log line, you can see the additional detail in structured JSON. That timestamp is duplicated in the column to the left, and the UUID is really not useful in this context. What I’d rather see is the event that caused the line to be logged and any corresponding error message.
It took some trial and error to make this happen. This post describes that process in case I or anyone else needs this in the future.
The Usefulness of Structured Logs
I believe the widespread use of format strings in logging is based on two presumptions:
The first level consumer of a log message is a human.
The programmer knows what information is needed to debug an issue.
I believe these presumptions are no longer correct in server side software.
This quote is from a 2011 blog post.
It’s only now that I’m getting involved with troubleshooting distributed systems running on AWS that I appreciate the value of Paul’s insight.
The ability to search the contents of log files combined with the ability to correlate log messages from disparate programs is a real game-changer.
(This coming from a programmer who still feels most comfortable trolling through /var/log with liberal grep and awk commands.)
I’ve seen the light. And so with this new effort, I’m using the Python Structlog package to simplify the building of the stuctured logs. The problem is that AWS is too smart for its own good. When you use the AWS-supplied Python installation, it:
- Sets the log level to WARN, and
- Sets the format string to include the timestamp and UUID of the Lambda call in front of anything you want to log.
Both of those are really annoying.
The way to get around the first is somewhat cumbersome, as this answer on Stack Overflow describes.
The nicest solution—if you are using Python 3.8 or higher—is to use the force=true on the logging.basicConfig call:
1
2
3
4
5
6
    logging.basicConfig(
        format="%(message)s",
        stream=sys.stdout,
        level=logging.DEBUG,
        force=True,
    )
The second line of this code snippet is the start of the solution to address the second problem described above—it clears out the AWS-supplied formatting string. In its place, we will put our own formatted string.
Tricking CloudWatch to Display Useful Content
I couldn’t find this documented anywhere, but there is a special format to CloudWatch lines that make them machine-processable.
If a program logs a line with three space-delimited fields followed by a string of JSON, CloudWatch will parse that JSON in the display and make it searchable.
In the default configuration, the three space-delimited fields are the log level (e.g. “[INFO]”), timestamp, and request UUID.
With our own Structlogs procesor, we can put what we want in those space-delimited fields.
I copied the built-in structlog.processors.JSONRenderer class and made the modifications to put the log level and two arbitrary values at the beginning of the log line.
You can see this effort in the AWSCloudWatchLogs class in log_config.py on GitHub.
Calling the setup looks like this:
1
2
3
4
def handler(event, context):
    setup_logging(context)
    log = structlog.get_logger()
    log.info("STARTED", httpapi_event=event)
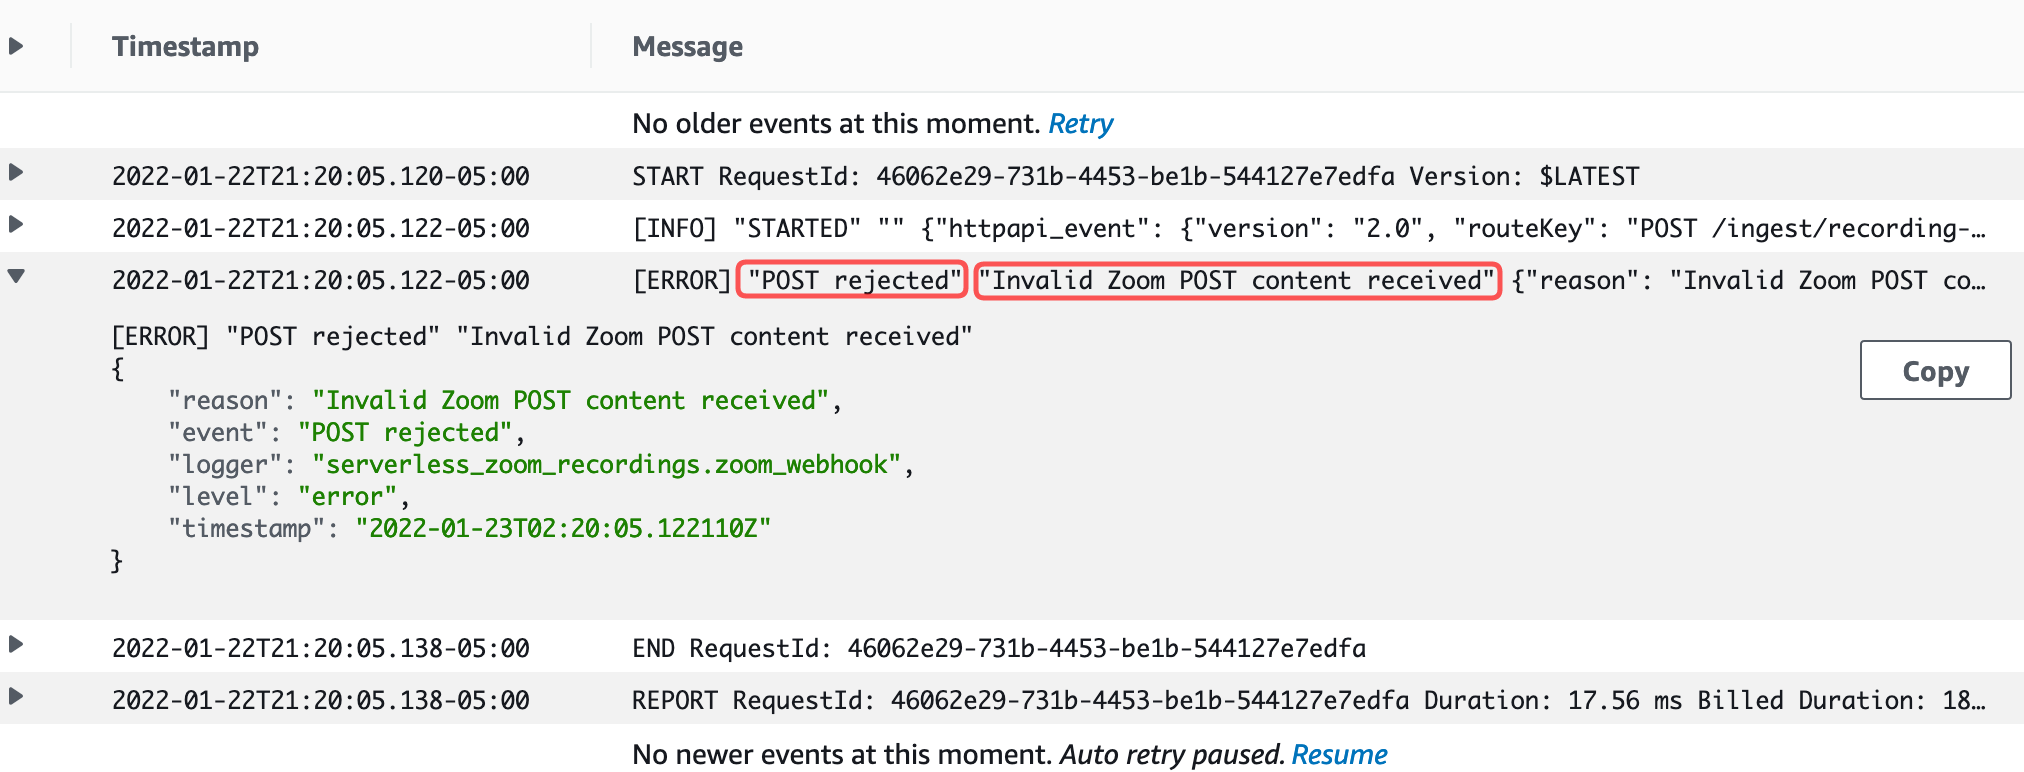
And an error log entry (with a reason variable) looks like this:
1
2
    reason = "Invalid Zoom POST content received"
    log.error("POST rejected", reason=reason)
You can see the results in the second screenshot above.
The best part is that because CloudWatch interprets the contents of the JSON part of the line, I can still collate together all of the log lines that correspond to a particular API Gateway request:
{ $.aws_request_id = "0d7924bb-ed97-4aa2-898f-90520a9f2e1b" }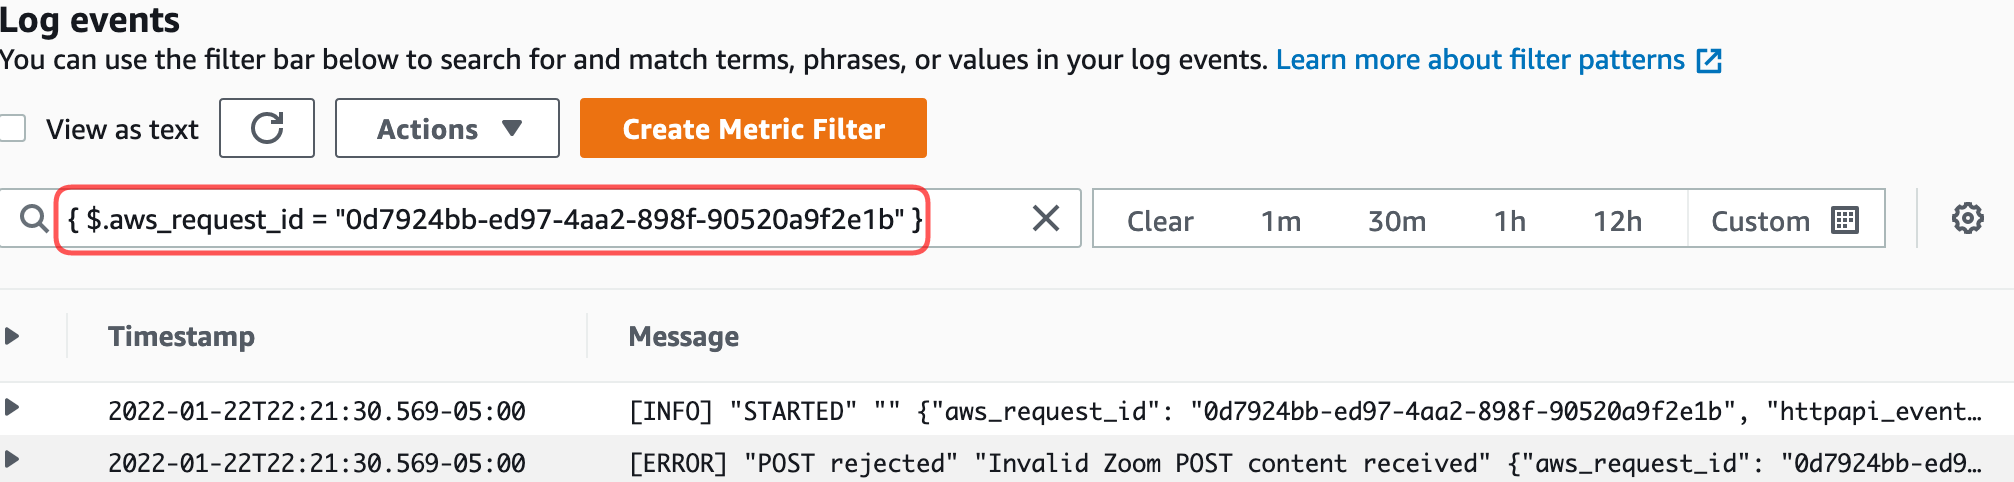
The AWS documentation has instructions for the query syntax to matching terms in log events.
Social Media Interactions
No reposts were found.
No likes were found.
Discussion
-
#Python #Automated A Better Structlog Processor for Python for CloudWatch Logs Using AWS Lambda dltj.org/article/python… -
A Better Structlog Processor for Python for CloudWatch Logs Using AWS Lambda
 Yohan J. Rodríguez
 Python Hub
